Thanks for the nice welcome…
I am
very new to this software as well as to the ideas most of you are expressing
here so please bear with me I'm certain many of my comments will seem
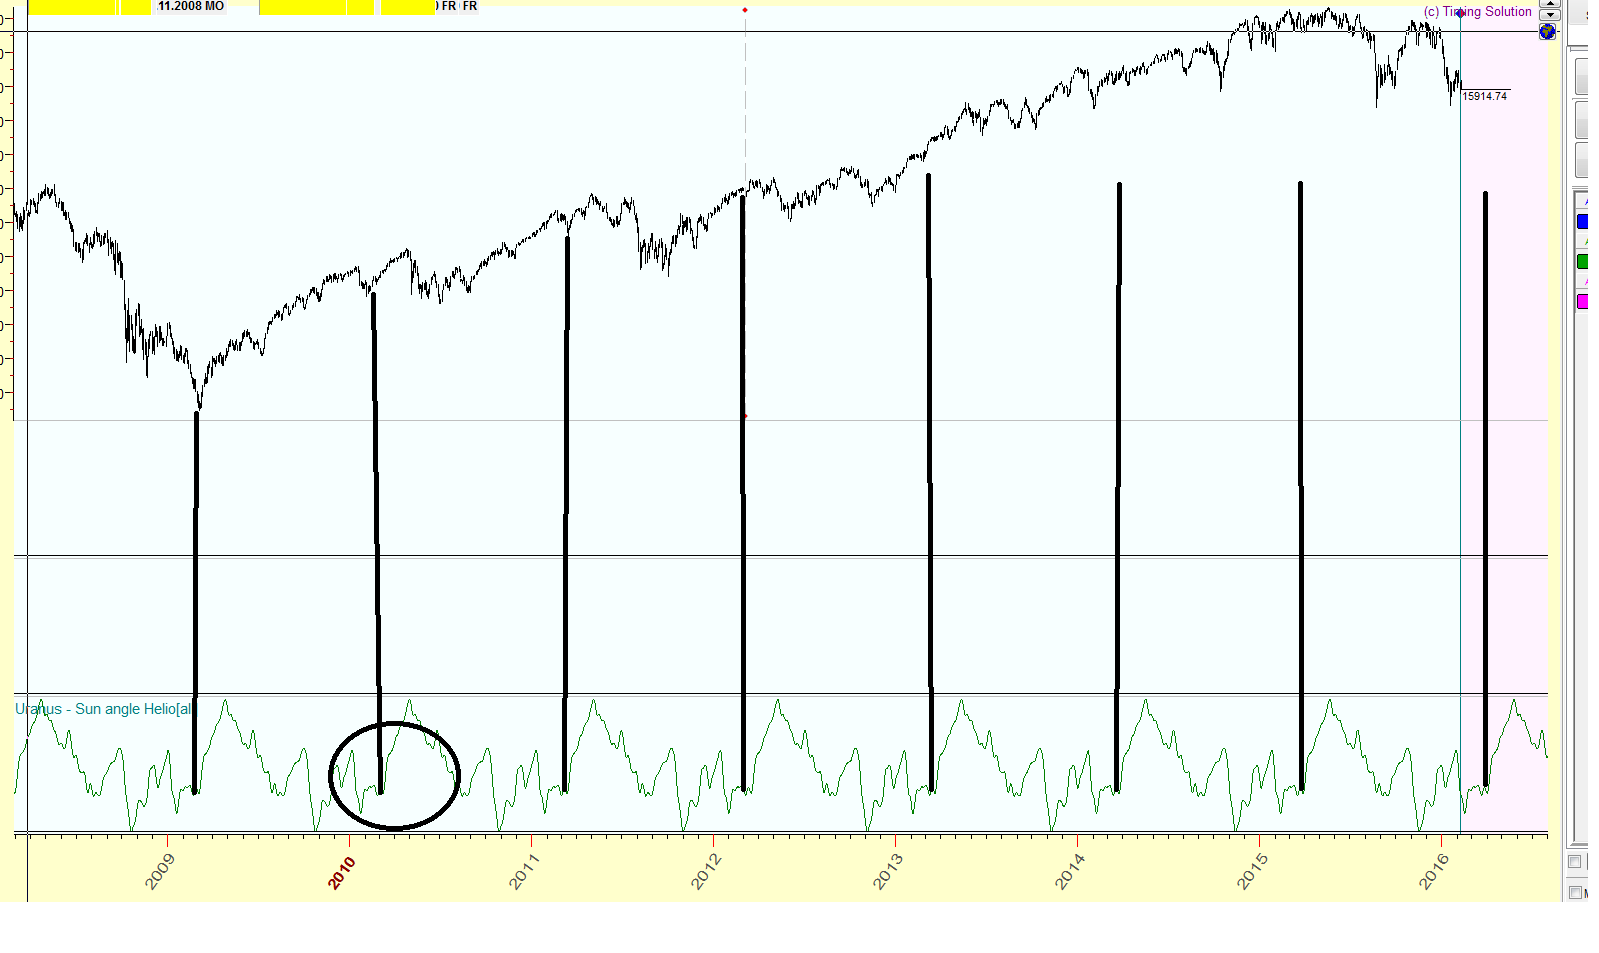
sophomoric at best. Nonetheless I would like to show the following chart which
I think has a pretty good record of setting up a buying area in the stock
market for us.
Now I
am clueless about what Uranus is, how it functions what it's angle is I don't
understand or know anything about all of that stuff. However I put it on the
chart, below, you can see that when it has what I would call a reverse
head and shoulder formation there is a little ledge… Marked off with black
vertical lines… That seems to be a springboard for stock prices.
I'm
certain others know much more about this and its significance than I do but it
is something I will be paying attention to as it is suggesting a rally to start
in late March which interest enough, is confirmed by the cycle stuff that I
work with.
Happy trails
to all.
LW
__._,_.___
Posted by: "Larry Williams" <larr******ms@att.net>
|
• |
• |
• |
• |

.jpg)


![]()
•
Privacy • Unsubscribe • Terms of Use
.
__,_._,___