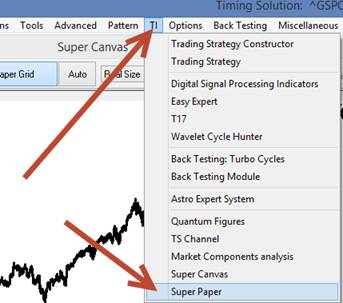
Finally, a pilot version of the new module, Paper Charting, is ready, and you
can see what it is about. It is in today's upgrade for Terra (follow
"TI"->"Super Paper"):
The module emulates a real price chart that might be drawn on a piece of paper.
In other words, when you drag/zoom the chart, all its proportions and sizes and
angles stay the same.
For example, if you initially draw 45-degree Gann fan, it stays the same
45-degree fan while you manipulate the price chart.
An important note: it is a pilot version only. I would say that the module is
complete about 50%.
Now, how does it work?
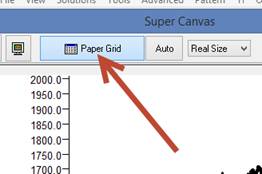
Press this button "Paper Grid":
You can define here parameters of your "paper": the number of bars
per 1 mm, $ amount per 1mm, etc.
Then press "Try" button.
The program will form a price chart that fits your parameters precisely.
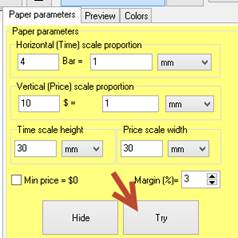
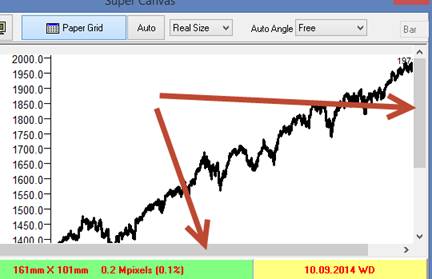
Here for EOD chart I set 4 trading days per mm for time scale and $10 per mm -
price scale (long term chart example).
This is how this price chart looks:
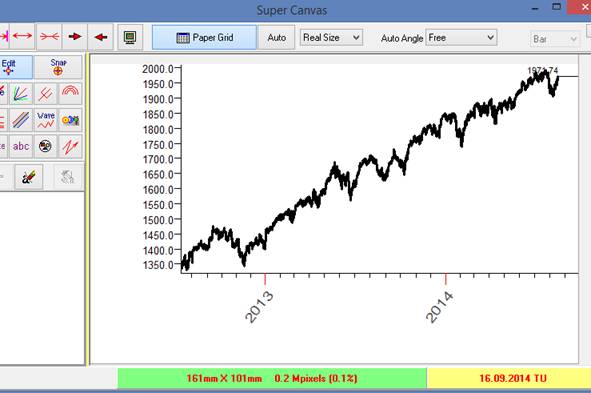
If the price chart is too big, please use scrolling controls:
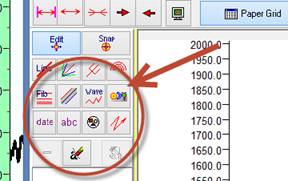
You can apply any charting tool to the price chart:
To draw the exact 45 degrees line use this feature:
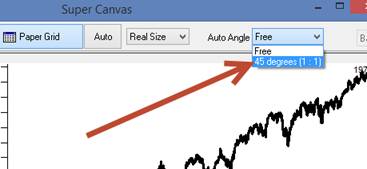
That is it so far.